钟鸣宇的实验报告
第一部分:获取公司年报并保存为csv文件
代码
import fitz
import re
import pandas as pd
from selenium import webdriver
from selenium.webdriver.common.by import By
from selenium.webdriver.common.keys import Keys
import time

doc = fitz.open('通用设备制造业.pdf')

p = re.compile('(\d+)\n\*?(.*)')

result = []
for page in doc.pages(83,85):
    txt = page.get_text()
    result = result+p.findall(txt)

result = sorted(set(result), key=result.index)

beg = 0
end = 0
for t in result:
    if t[0]=='56':
       beg = result.index(t)
    elif t[0]=='58':
        end = result.index(t)

df = pd.DataFrame({'行业大类代码': result[beg][0],
                   '行业大类名称': result[beg][1],
                   '上市公司代码': [t[0] for t in result[beg+1:end]],
                   '上市公司简称': [t[1] for t in result[beg+1:end]]})

df.to_csv('行业信息.csv')

#爬取深交所上市公司年报链接
browser = webdriver.Edge()

class DisclosureTable_sz():
    '''
    解析深交所定期报告页搜索表格
    '''
    def __init__(self, innerHTML):
        self.html = innerHTML
        self.prefix = 'https://disc.szse.cn/download'
        self.prefix_href = 'https://www.szse.cn/'

        p_a = re.compile('(.*?)', re.DOTALL)
        p_span = re.compile('(.*?)', re.DOTALL)
        self.get_code = lambda txt: p_a.search(txt).group(1).strip()
        self.get_time = lambda txt: p_span.search(txt).group(1).strip()

        self.txt_to_df()

    def txt_to_df(self):
        html = self.html
        p = re.compile('(.*?)', re.DOTALL)
        trs = p.findall(html)

        p2 = re.compile('(.*?)', re.DOTALL)
        tds = [p2.findall(tr) for tr in trs[1:]]

        df = pd.DataFrame({'证券代码': [td[0] for td in tds],
                           '简称': [td[1] for td in tds],
                           '公告标题': [td[2] for td in tds],
                           '公告时间': [td[3] for td in tds]})
        self.df_txt = df

    def get_link(self, txt):
        p_txt = '(.*?)'
        p = re.compile(p_txt, re.DOTALL)
        matchObj = p.search(txt)
        attachpath = matchObj.group(1).strip()
        href       = matchObj.group(2).strip()
        title      = matchObj.group(3).strip()
        return([attachpath, href, title])

    def get_data(self):
        get_code = self.get_code
        get_time = self.get_time
        get_link = self.get_link

        df = self.df_txt
        codes = [get_code(td) for td in df['证券代码']]
        short_names = [get_code(td) for td in df['简称']]
        ahts = [get_link(td) for td in df['公告标题']]
        times = [get_time(td) for td in df['公告时间']]

        prefix = self.prefix
        prefix_href = self.prefix_href
        df = pd.DataFrame({'证券代码': codes,
                           '简称': short_names,
                           '公告标题': [aht[2] for aht in ahts],
                           'attachpath': [prefix + aht[0] for aht in ahts],
                           'href': [prefix_href + aht[1] for aht in ahts],
                           '公告时间': times
            })
        self.df_data = df
        return(df)

browser.get('https://www.szse.cn/disclosure/listed/fixed/index.html')
browser.implicitly_wait(8)

for name in df.iloc[0:4,3]:
    element = browser.find_element(By.ID, 'input_code')
    element.send_keys(name + Keys.RETURN)
    browser.find_element(By.LINK_TEXT, '请选择公告类别').click()
    browser.find_element(By.LINK_TEXT, '年度报告').click()
    y_start = browser.find_element(By.CLASS_NAME, 'input-left')
    y_start.send_keys('2012' + Keys.RETURN)
    y_end = browser.find_element(By.CLASS_NAME, 'input-right')
    y_end.send_keys('2021' + Keys.RETURN)
    time.sleep(1)

    element = browser.find_element(By.ID, 'disclosure-table')
    innerHTML = element.get_attribute('innerHTML')
    browser.find_element(By.CSS_SELECTOR, ".btn-clearall").click()
    html = innerHTML
    dt = DisclosureTable_sz(html)
    df1 = dt.get_data()
    p = re.compile(".*?(\*).*?")
    biaoti = [p.sub("",t) for t in df1['公告标题']]
    df1['公告标题'] = biaoti;del p,biaoti
    df1.to_csv(name+'.csv')

browser.quit()

#爬取上交所上市公司年报链接
class DisclosureTable_sh():
    '''
    解析上交所定期报告页搜索表格
    '''
    def __init__(self, innerHTML):
        self.html = innerHTML
        self.prefix_href = 'http://www.sse.com.cn/'

        p_span = re.compile('(.*?)', re.DOTALL)
        self.get_span = lambda txt: p_span.search(txt).group(1).strip()

        self.txt_to_df()

    def txt_to_df(self):
        html = self.html
        p = re.compile('(.+?)', re.DOTALL)
        trs = p.findall(html)

        p2 = re.compile('(.*?)', re.DOTALL)
        tds = [p2.findall(tr) for tr in trs[1:]]

        df = pd.DataFrame({'证券代码': [td[0] for td in tds],
                           '简称': [td[1] for td in tds],
                           '公告标题': [td[2] for td in tds],
                           '公告时间': [td[3] for td in tds]})
        self.df_txt = df

    def get_link(self, txt):
        p_txt = '(.*?)'
        p = re.compile(p_txt, re.DOTALL)
        matchObj = p.search(txt)
        href     = matchObj.group(1).strip()
        title    = matchObj.group(2).strip()
        return([href, title])

    def get_data(self):
        get_span = self.get_span
        get_link = self.get_link

        df = self.df_txt
        codes = [get_span(td) for td in df['证券代码']]
        short_names = [get_span(td) for td in df['简称']]
        ahts = [get_link(td) for td in df['公告标题']]
        times = [td for td in df['公告时间']]

        prefix_href = self.prefix_href
        df = pd.DataFrame({'证券代码': codes,
                           '简称': short_names,
                           '公告标题': [aht[1] for aht in ahts],
                           'href': [prefix_href + aht[0] for aht in ahts],
                           '公告时间': times
            })
        self.df_data = df
        return(df)

def check_nextpage(driver):
    try:
        driver.find_element(By.LINK_TEXT, '下一页')
        return True
    except:
        return False

browser = webdriver.Edge()
browser.implicitly_wait(5)

i = 4
for code in df.iloc[4:,2]:
    browser.get('http://www.sse.com.cn/disclosure/listedinfo/regular/')
    time.sleep(1)
    element = browser.find_element(By.ID, 'inputCode')
    element.send_keys(code)
    browser.find_element(By.CSS_SELECTOR, ".sse_outerItem:nth-child(4) .filter-option-inner-inner").click()
    browser.find_element(By.LINK_TEXT, "年报").click()
    time.sleep(1)

    element = browser.find_element(By.CLASS_NAME, 'table-responsive')
    innerHTML = element.get_attribute('innerHTML')
    html = innerHTML
    dt = DisclosureTable_sh(html)
    df1 = dt.get_data()

    if check_nextpage(browser) == True:
        while True:
            nextpage = browser.find_element(By.LINK_TEXT,'下一页')
            nextpage.click()
            time.sleep(1)
            element = browser.find_element(By.CLASS_NAME, 'table-responsive')
            innerHTML = element.get_attribute('innerHTML')
            html = innerHTML
            dt = DisclosureTable_sh(html)
            df2 = dt.get_data()
            df1 = df1.append(df2)
            break
    df1.reset_index(drop=True,inplace=True)
    name = df.iloc[i,3]
    p = re.compile(".*?(\*).*?")
    biaoti = [p.sub("",t) for t in df1['公告标题']]
    df1['公告标题'] = biaoti;del p,biaoti
    df1.to_csv(name+'.csv')
    i = i+1

browser.quit()
结果
尝试了许多方法我依旧安装不了fitz与pdfplumber所以很遗憾我看不到结果。以下绘图结果为我手动获取数据制作而成。
第二部分:绘图代码
import pandas as pd
import matplotlib.pyplot as plt
from pylab import mpl
mpl.rcParams['font.sans-serif']=['SimHei']
mpl.rcParams['axes.unicode_minus']=False
df = pd.read_csv('通用设备制造业.csv',index_col=0,dtype=(str))
df_eps = pd.read_csv('通用设备制造业基本每股收益数据.csv',index_col=0)
df_revenue = pd.read_csv('通用设备制造业主营业务收入数据.csv',index_col=0)
df_information = pd.read_csv('通用设备制造业上市公司基本信息.csv',index_col=0,dtype=(str))
df_revenue = df_revenue/100000000
df_revenue.loc['sum'] = df_revenue.sum()
df_revenue = df_revenue.T
df_revenue = df_revenue.sort_values(by='sum',ascending=False,axis=0)
df_revenue = df_revenue.iloc[:10]
top10_list = df_revenue.index.values.tolist()
for i in range(len(top10_list)):
top10_list[i] = top10_list[i][:-6]
df_revenue = df_revenue.T
df_revenue = df_revenue.iloc[:-1]
for name in df['上市公司简称']:
if name not in top10_list:
df_eps.drop(columns=[name+'基本每股收益'], axis=1, inplace=True)
for name in top10_list:
df_revenue.rename(columns={name+'主营业务收入':name}, inplace=True)
df_eps.rename(columns={name+'基本每股收益':name}, inplace=True)
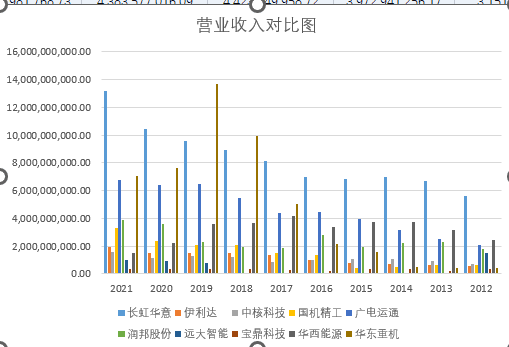
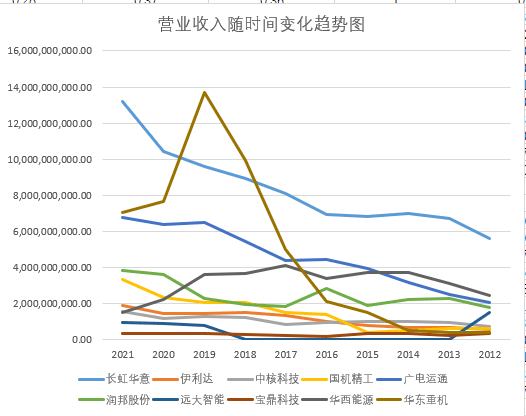
#主营业务收入
plt.figure(figsize=(10,8))
x = df_revenue.index
y_1 = df_revenue.iloc[:,0]
y_2 = df_revenue.iloc[:,1]
y_3 = df_revenue.iloc[:,2]
y_4 = df_revenue.iloc[:,3]
y_5 = df_revenue.iloc[:,4]
plt.plot(x, y_1, marker='^', markersize=8, label=df_revenue.columns[0], linewidth=2.0)
plt.plot(x, y_2, marker='^', markersize=8, label=df_revenue.columns[1], linewidth=2.0)
plt.plot(x, y_3, marker='^', markersize=8, label=df_revenue.columns[2], linewidth=2.0)
plt.plot(x, y_4, marker='^', markersize=8, label=df_revenue.columns[3], linewidth=2.0)
plt.plot(x, y_5, marker='^', markersize=8, label=df_revenue.columns[4], linewidth=2.0)
plt.xticks(range(2012,2022), fontsize=16)
plt.xlabel("年份", fontsize=16)
plt.yticks(fontsize=16)
plt.ylabel("主营业务收入(亿元)", fontsize=16)
plt.title("2012-2021年通用设备制造业上市公司主营业务收入随时间变化趋势图", fontsize=16)
plt.legend(loc=1, prop={'size':15})
plt.grid()
#主营业务收入(续)
plt.figure(figsize=(10,8))
y_6 = df_revenue.iloc[:,5]
y_7 = df_revenue.iloc[:,6]
y_8 = df_revenue.iloc[:,7]
y_9 = df_revenue.iloc[:,8]
y_10 = df_revenue.iloc[:,9]
plt.plot(x, y_6, marker='^', markersize=8, label=df_revenue.columns[5], linewidth=2.0)
plt.plot(x, y_7, marker='^', markersize=8, label=df_revenue.columns[6], linewidth=2.0)
plt.plot(x, y_8, marker='^', markersize=8, label=df_revenue.columns[7], linewidth=2.0)
plt.plot(x, y_9, marker='^', markersize=8, label=df_revenue.columns[8], linewidth=2.0)
plt.plot(x, y_10, marker='^', markersize=8, label=df_revenue.columns[9], linewidth=2.0)
plt.xticks(range(2012,2022), fontsize=16)
plt.xlabel("年份", fontsize=16)
plt.yticks(fontsize=16)
plt.ylabel("主营业务收入(亿元)", fontsize=16)
plt.title("2012-2021年通用设备制造业上市公司主营业务收入随时间变化趋势图(续)", fontsize=16)
plt.legend(loc=1, prop={'size': 15})
plt.grid()
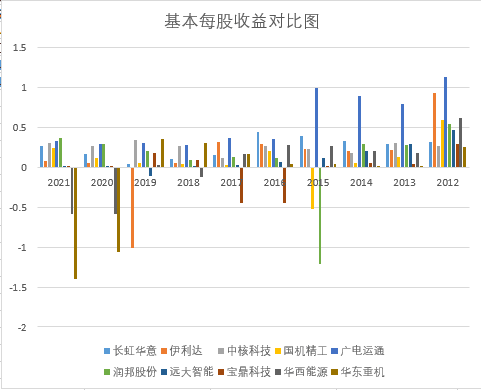
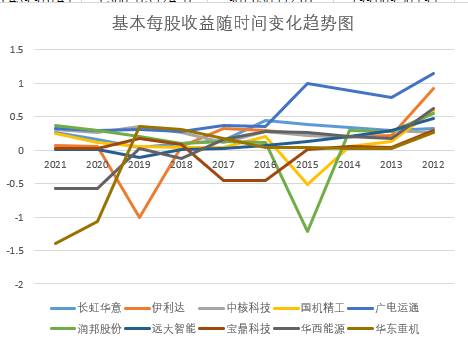
#基本每股收益
plt.figure(figsize=(10,8))
x = df_eps.index
y_1 = df_eps.iloc[:,4]
y_2 = df_eps.iloc[:,8]
y_3 = df_eps.iloc[:,5]
y_4 = df_eps.iloc[:,6]
y_5 = df_eps.iloc[:,1]
plt.plot(x, y_1, marker='s', markersize=7, label=df_eps.columns[4], linewidth=2.0)
plt.plot(x, y_2, marker='s', markersize=7, label=df_eps.columns[8], linewidth=2.0)
plt.plot(x, y_3, marker='s', markersize=7, label=df_eps.columns[5], linewidth=2.0)
plt.plot(x, y_4, marker='s', markersize=7, label=df_eps.columns[6], linewidth=2.0)
plt.plot(x, y_5, marker='s', markersize=7, label=df_eps.columns[1], linewidth=2.0)
plt.xticks(range(2012,2022), fontsize=16)
plt.xlabel("年份", fontsize=16)
plt.yticks(fontsize=16)
plt.ylabel("基本每股收益(元/股)", fontsize=16)
plt.title("2012-2021年通用设备制造业上市公司基本每股收益随时间变化趋势图", fontsize=16)
plt.legend(loc=0, prop={'size':15})
plt.grid()
#基本每股收益(续)
plt.figure(figsize=(10,8))
y_6 = df_eps.iloc[:,9]
y_7 = df_eps.iloc[:,7]
y_8 = df_eps.iloc[:,3]
y_9 = df_eps.iloc[:,2]
y_10 = df_eps.iloc[:,0]
plt.plot(x, y_6, marker='s', markersize=7, label=df_eps.columns[9], linewidth=2.0)
plt.plot(x, y_7, marker='s', markersize=7, label=df_eps.columns[7], linewidth=2.0)
plt.plot(x, y_8, marker='s', markersize=7, label=df_eps.columns[3], linewidth=2.0)
plt.plot(x, y_9, marker='s', markersize=7, label=df_eps.columns[2], linewidth=2.0)
plt.plot(x, y_10, marker='s', markersize=7, label=df_eps.columns[0], linewidth=2.0)
plt.xticks(range(2012,2022), fontsize=16)
plt.xlabel("年份", fontsize=16)
plt.yticks(fontsize=16)
plt.ylabel("基本每股收益(元/股)", fontsize=16)
plt.title("2012-2021年通用设备制造业上市公司基本每股收益随时间变化趋势图(续)", fontsize=16)
plt.legend(loc=1, prop={'size': 15})
plt.grid()
绘图结果