import json
import os
from time import sleep
from urllib import parse
import requests
import time,random
from fake_useragent import UserAgent

ua = UserAgent()
userAgen = ua.random
def get_adress(bank_name):
    url = "http://www.cninfo.com.cn/new/information/topSearch/detailOfQuery"
    data = {
        'keyWord': bank_name,
        'maxSecNum': 10,
        'maxListNum': 5,
    }
    hd = {
        'Host': 'www.cninfo.com.cn',
        'Origin': 'http://www.cninfo.com.cn',
        'Pragma': 'no-cache',
        'Accept-Encoding': 'gzip,deflate',
        'Connection': 'keep-alive',
        'Content-Length': '70',
        'User-Agent':userAgen,
        'Content-Type': 'application/x-www-form-urlencoded; charset=UTF-8',
        'Accept': 'application/json,text/plain,*/*',
        'Accept-Language': 'zh-CN,zh;q=0.9,en;q=0.8',
    }
    get_json = requests.post(url, headers=hd, data=data)
    data_json = get_json.content
    toStr = str(data_json, encoding="utf-8")
    last_json = json.loads(toStr)
    orgId = last_json["keyBoardList"][0]["orgId"]  # 获取参数
    plate = last_json["keyBoardList"][0]["plate"]
    code = last_json["keyBoardList"][0]["code"]
    return orgId, plate, code

def download_PDF(url, file_name):  # 下载pdf
    url = url
    r = requests.get(url)
    f = open(company + "/" + file_name + ".pdf", "wb")
    f.write(r.content)


def get_PDF(orgId, plate, code):
    url = "http://www.cninfo.com.cn/new/hisAnnouncement/query"
    data = {
        'stock': '{},{}'.format(code, orgId),
        'tabName': 'fulltext',
        'pageSize': 20,
        'pageNum': 1,
        'column': plate,
        'category': 'category_ndbg_szsh;',
        'plate': '',
        'seDate': '',
        'searchkey': '',
        'secid': '',
        'sortName': '',
        'sortType': '',
        'isHLtitle': 'true',
    }

    hd = {
        'Host': 'www.cninfo.com.cn',
        'Origin': 'http://www.cninfo.com.cn',
        'Pragma': 'no-cache',
        'Accept-Encoding': 'gzip,deflate',
        'Connection': 'keep-alive',
        'User-Agent': ua.random,
        'Content-Type': 'application/x-www-form-urlencoded; charset=UTF-8',
        'Accept': 'application/json,text/plain,*/*',
        'Accept-Language': 'zh-CN,zh;q=0.9,en;q=0.8',
        'X-Requested-With': 'XMLHttpRequest',
    }
    data = parse.urlencode(data)
    data_json = requests.post(url, headers=hd, data=data)
    toStr = str(data_json.content, encoding="utf-8")
    last_json = json.loads(toStr)
    reports_list = last_json['announcements']
    for report in reports_list:
        if '摘要' in report['announcementTitle'] or "20" not in report['announcementTitle']:
            continue
        if 'H' in report['announcementTitle']:
            continue
        else:  # http://static.cninfo.com.cn/finalpage/2019-03-29/1205958883.PDF
            pdf_url = "http://static.cninfo.com.cn/" + report['adjunctUrl']
            file_name = report['announcementTitle']
            print("正在下载:" + pdf_url, "存放在当前目录:/" + company + "/" + file_name)
            download_PDF(pdf_url, file_name)
            time.sleep(random.random()*3)


if __name__ == '__main__':
    list = ["002207","002554","002629","002683","002828","300084","300157","300164","300191","600583","600871",
            "600968","601808","603619","603727","603979"]
    for company in list:
        os.mkdir(company)
        orgId, plate, code=get_adress(company)
        get_PDF(orgId, plate, code)
        print("下载成功")
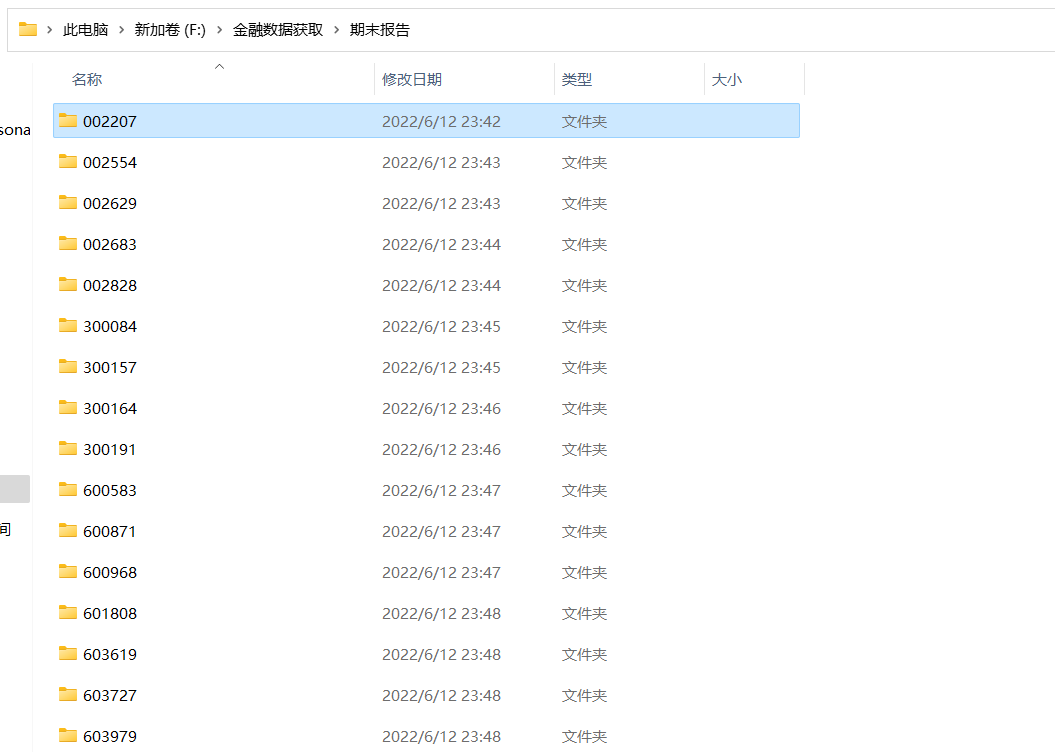
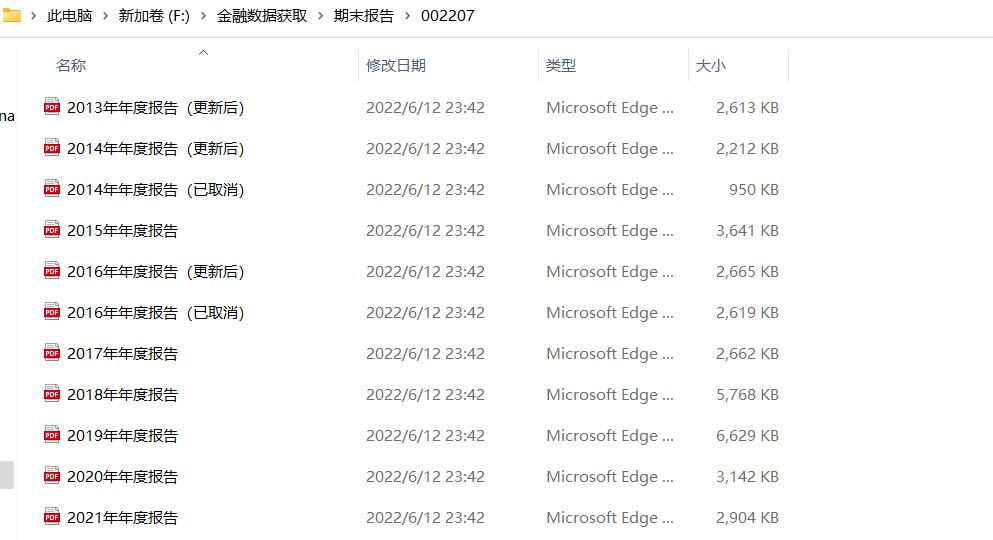
将所分配的公司的年报从网站上爬取下来.
  import pdfplumber,os
import pandas as pd

def getfns(path,suffix):
	res=[os.path.join(path,fname) for fname in os.listdir(path) if fname.endswith(suffix)]
	return res

path='F:\金融数据获取\期末报告\pdf'

fns=getfns(path,'.pdf')


def f1(lst):#get c1
	c1=[e[0]for e in lst]
	return c1

def f2(lst):#get c1 and c2
	c12=[e[:2] for e in lst]
	return c12

cnt=[];yy=[]
def l2d(df):
	idx=list(df.index)
	if '营业收入(元)' in idx and '基本每股收益(元/股)' in idx:
		return True

#营业收入  基本每股收益 股票简称  股票代码  办公地址 公司网址 年份


tbs=[]
for e in fns:
	if '更新' not in e:
		cnt=0
		with pdfplumber.open(e) as pdf:
			for page in pdf.pages:
				d=page.extract_table()
				if d!=None:
					c1=f1(d)
					if ""==c1[0] and '营业收入(元)' in c1 and '基本每股收益(元/股)' in c1:
						c12=f2(d)
						print(c12[0][1],c12[1][1])
						for c in c12:
							if c[0]=='基本每股收益(元/股)':
								print(c[1])

						break

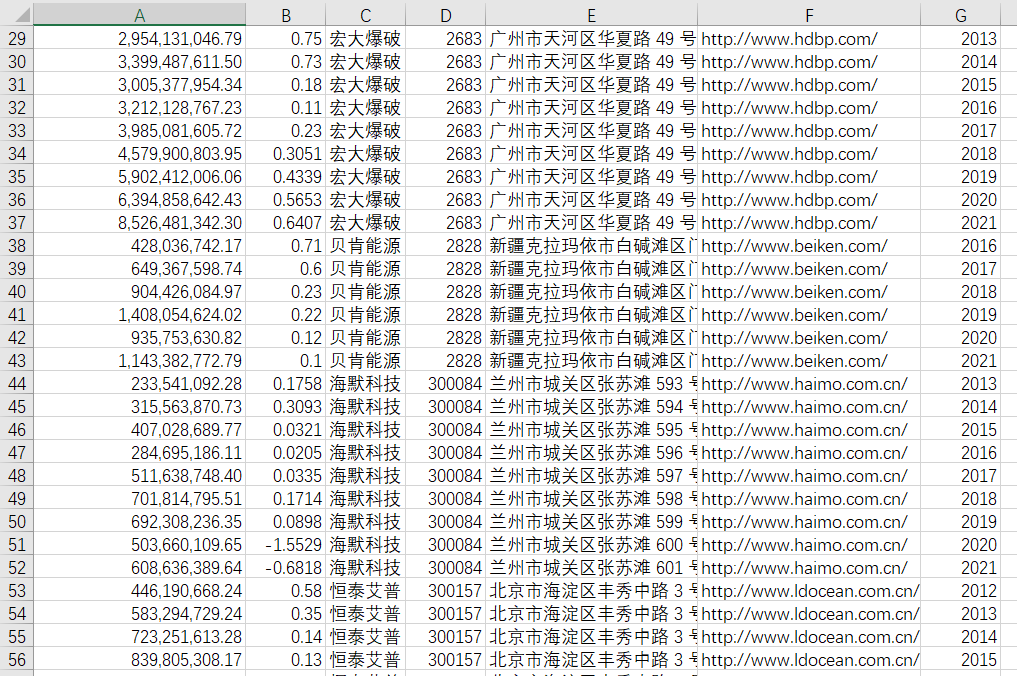
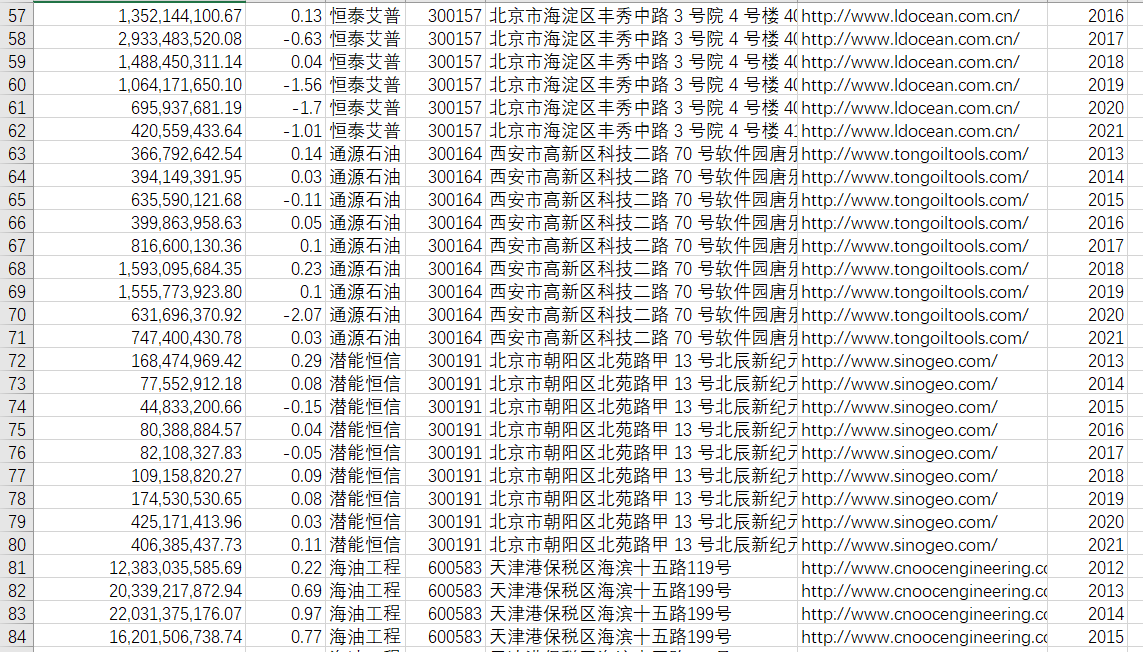
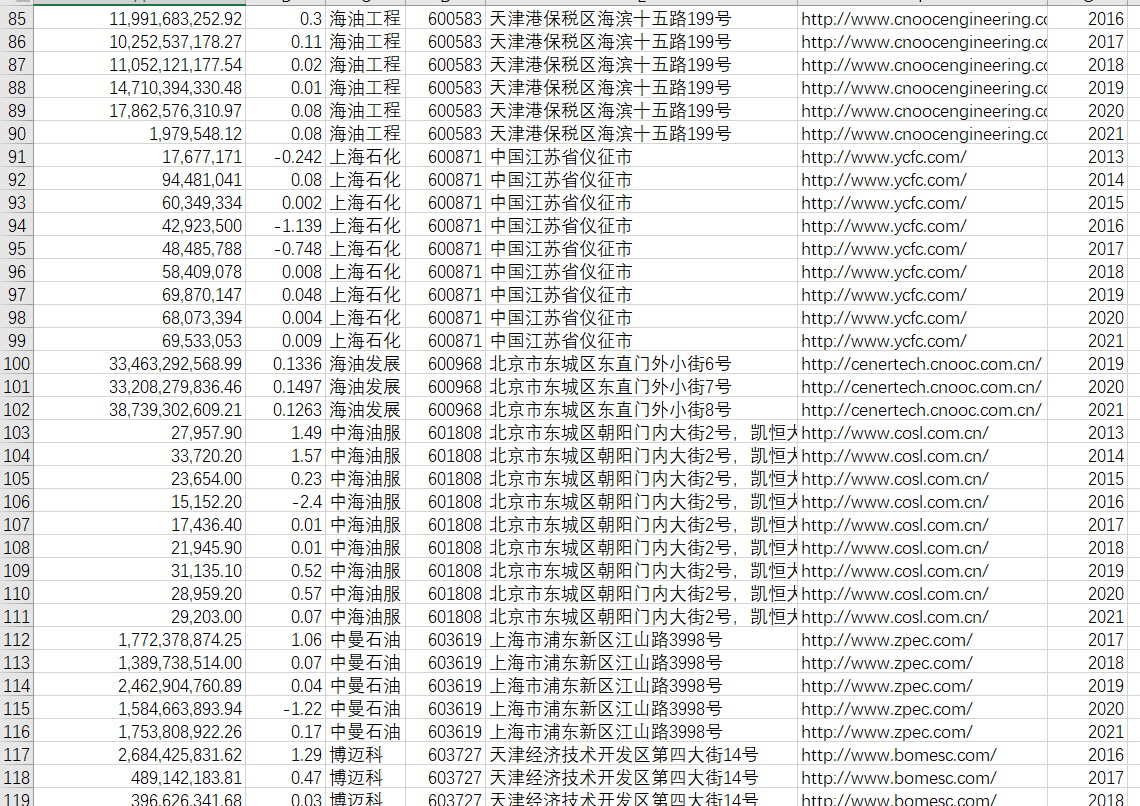
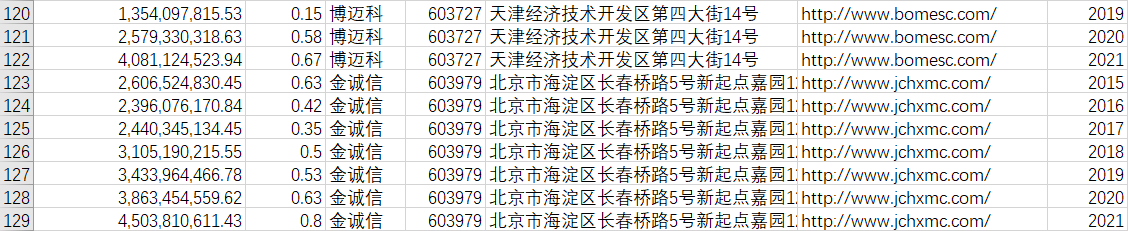
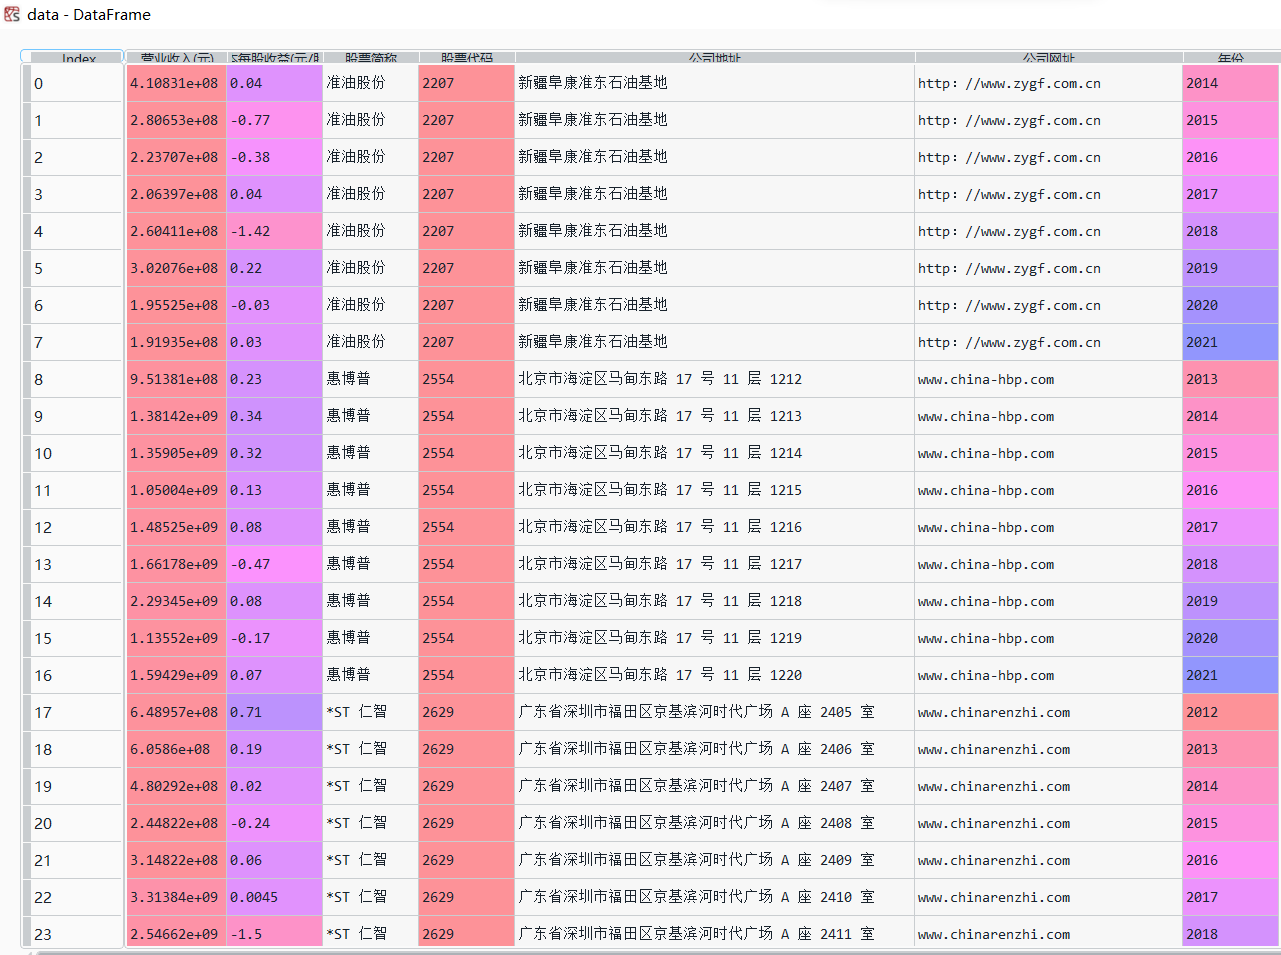
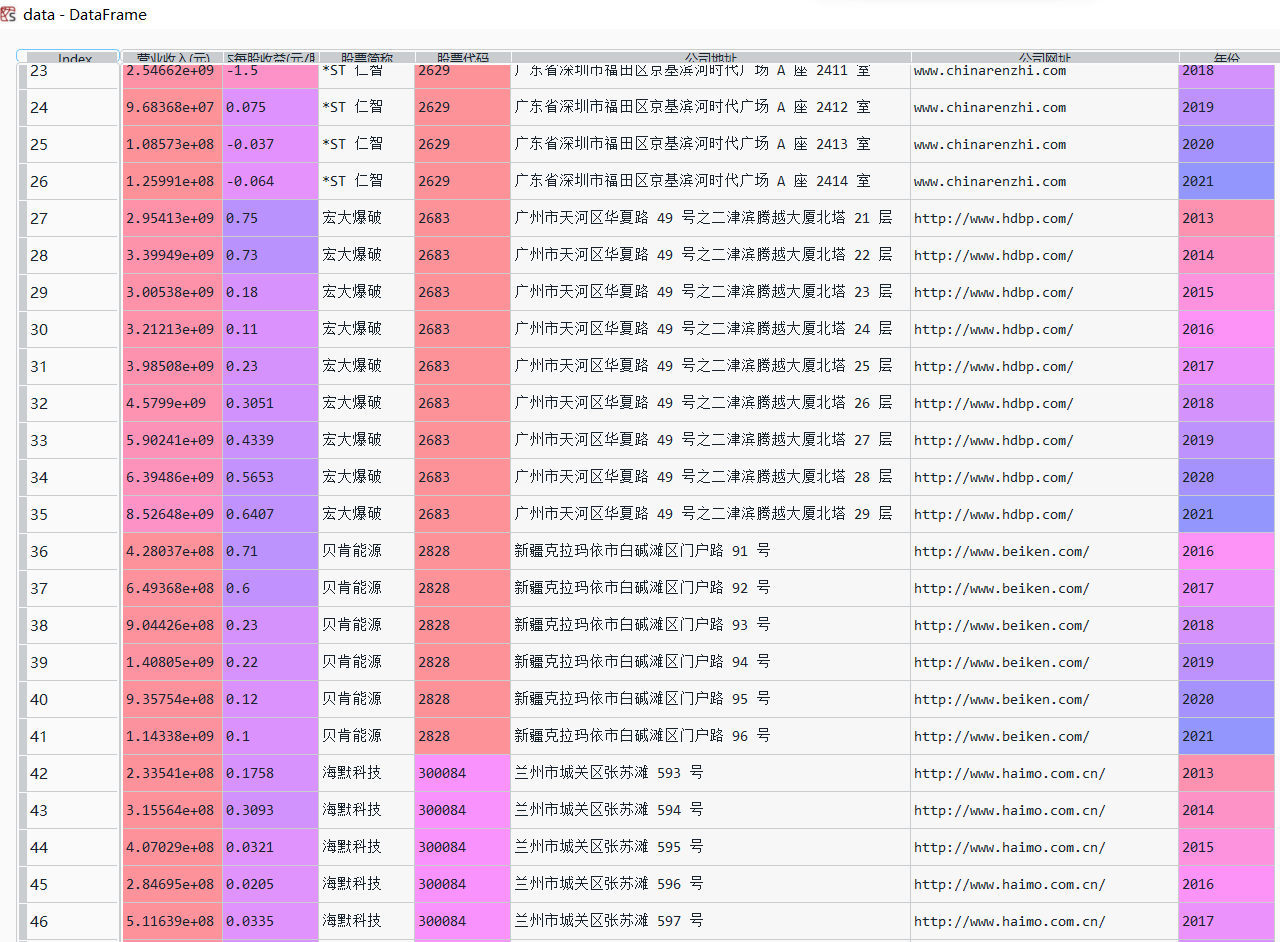
此代码并不会生成文件,因为文件数据比较少。因此用代码来做辅助,然后直接把数据整理至文件“数据.csv”中。
import pandas as pd
from collections import Counter
from matplotlib import pyplot as plt
import pandas as pd
from collections import Counter
from matplotlib import pyplot as plt
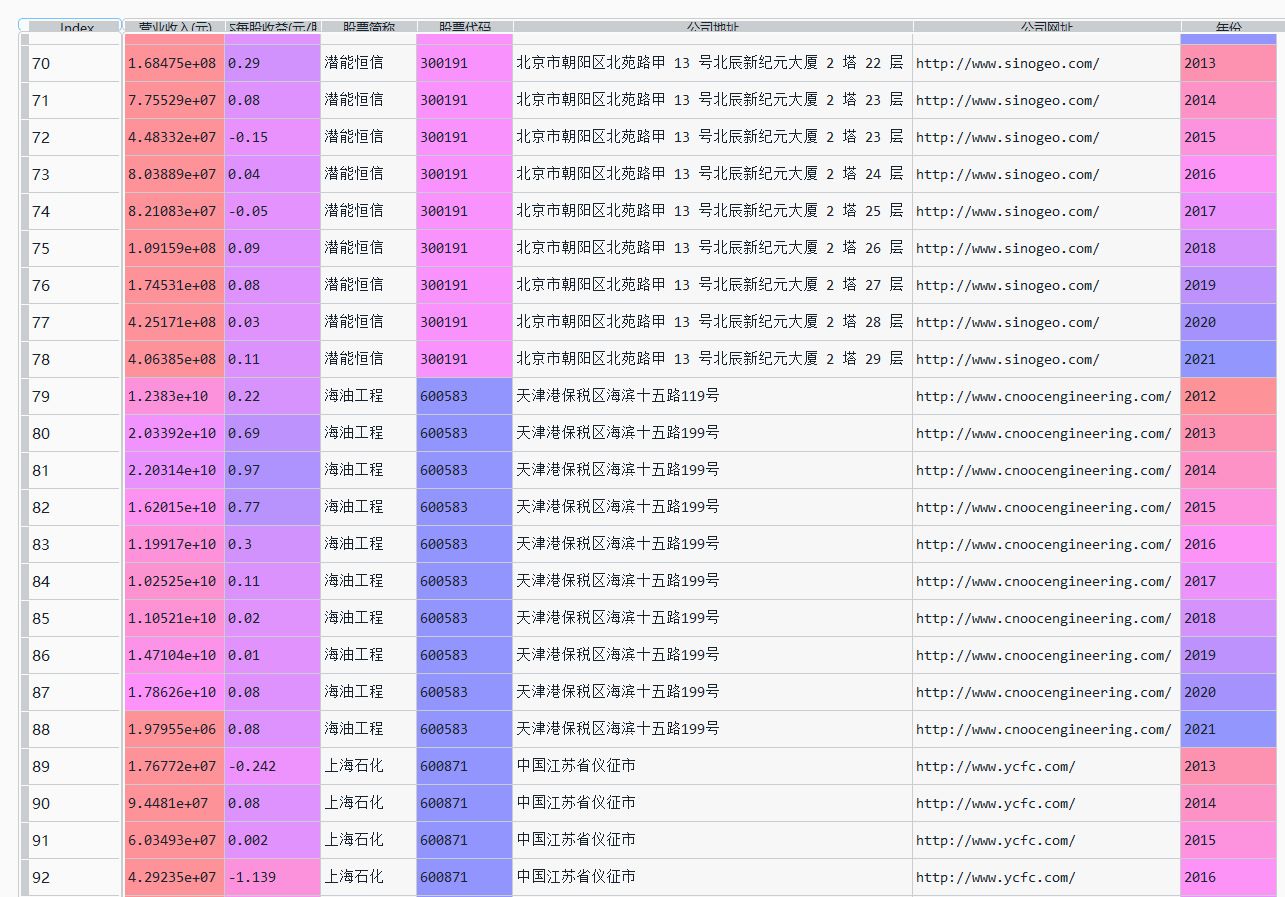
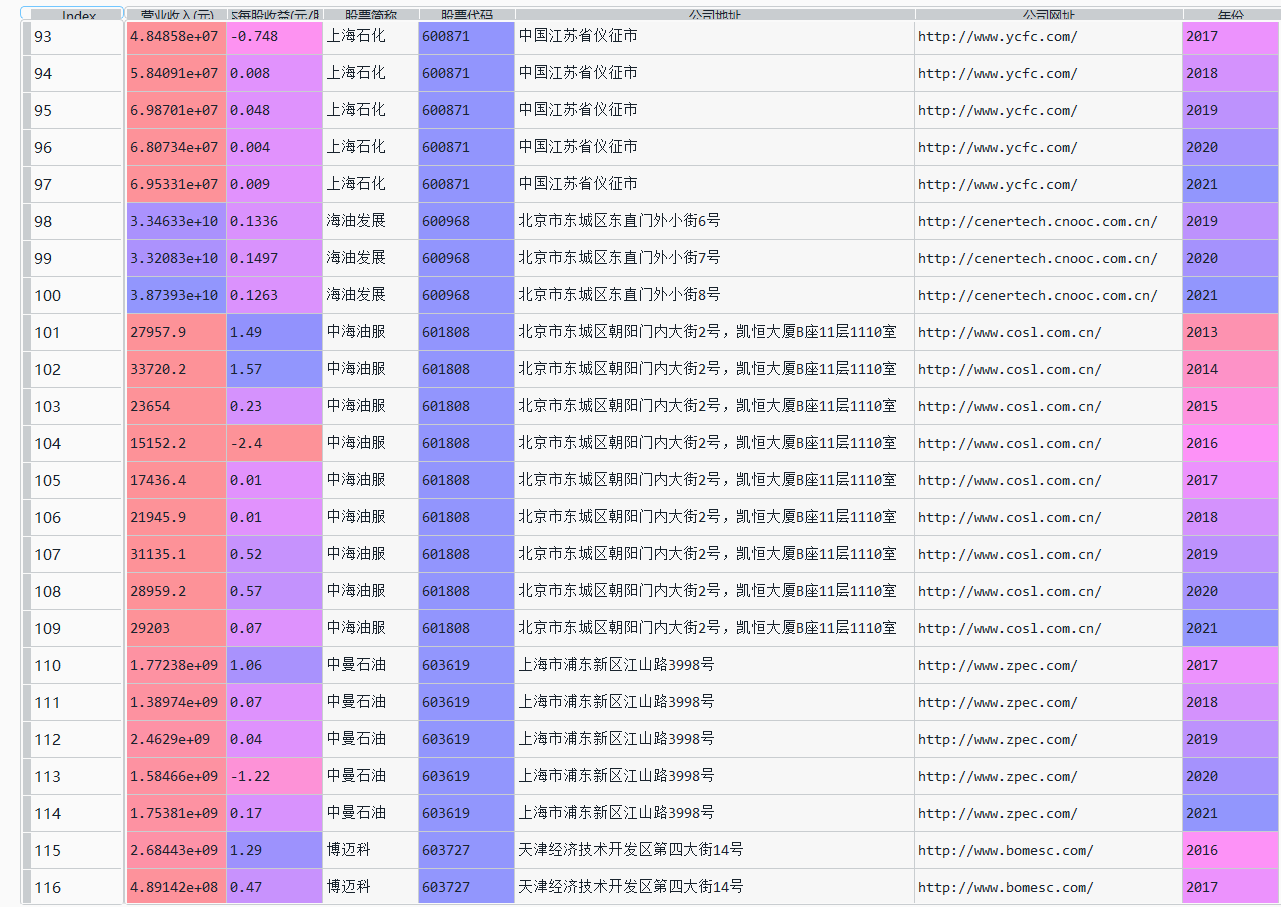
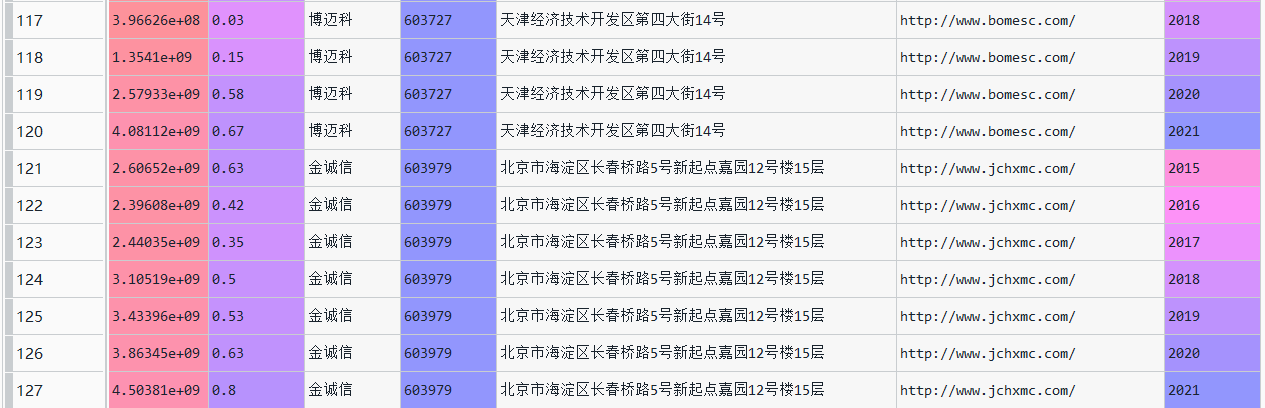
data = pd.read_csv("数据.csv")
data
data.drop("Unnamed: 7",axis=1,inplace=True)
map_data = dict(Counter(data['股票简称']))
print(map_data)
print("=========================================================")
print("共有{}家公司".format(len(map_data)))
data["营业收入(元)"]=[i.replace(",","") for i in data["营业收入(元)"]]
data["营业收入(元)"]=data["营业收入(元)"].astype("float")
data["基本每股收益(元/股)"]=data["基本每股收益(元/股)"].astype("float")
data.groupby("股票简称").sum().sort_values("营业收入(元)",ascending=False)["营业收入(元)"][0:10]
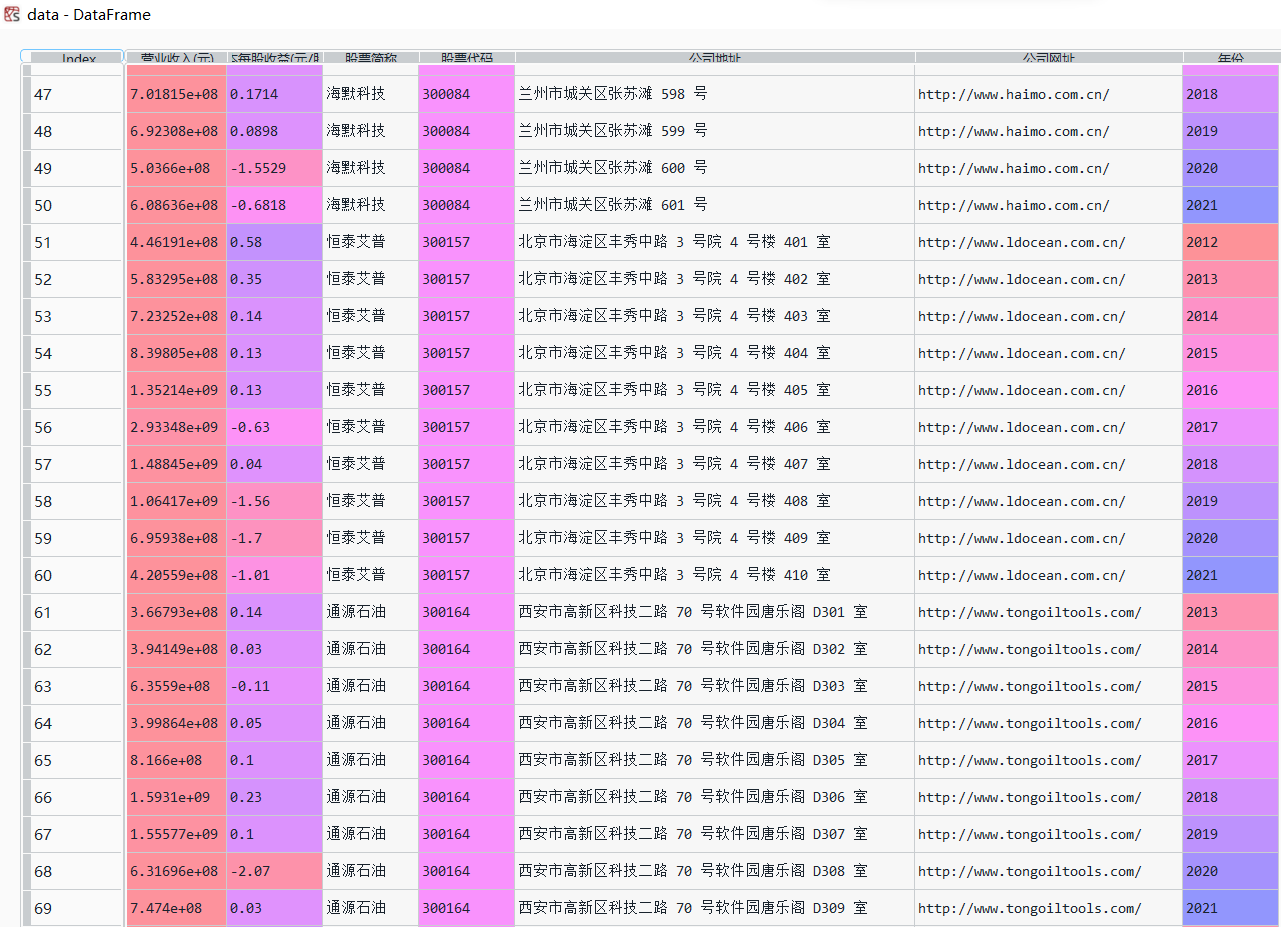
从上一步已经提取的数据中再次进行提取。
year = dict(Counter(data['年份']))
year_list = [int(i) for i in year.keys()]
year_list.sort()
print(year_list)
hygc = data.loc[data["股票简称"]=="海油工程",["营业收入(元)","年份","基本每股收益(元/股)"]]
hyfz = data.loc[data["股票简称"]=="海油发展",["营业收入(元)","年份","基本每股收益(元/股)"]]
hdbp = data.loc[data["股票简称"]=="宏大爆破",["营业收入(元)","年份","基本每股收益(元/股)"]]
jcx = data.loc[data["股票简称"]=="金诚信",["营业收入(元)","年份","基本每股收益(元/股)"]]
hbp = data.loc[data["股票简称"]=="惠博普",["营业收入(元)","年份","基本每股收益(元/股)"]]
bmk = data.loc[data["股票简称"]=="博迈科",["营业收入(元)","年份","基本每股收益(元/股)"]]
htap = data.loc[data["股票简称"]=="恒泰艾普",["营业收入(元)","年份","基本每股收益(元/股)"]]
zmsy = data.loc[data["股票简称"]=="中曼石油",["营业收入(元)","年份","基本每股收益(元/股)"]]
strz = data.loc[data["股票简称"]=="*ST 仁智",["营业收入(元)","年份","基本每股收益(元/股)"]]
tysy = data.loc[data["股票简称"]=="通源石油",["营业收入(元)","年份","基本每股收益(元/股)"]]
plt.rcParams['font.sans-serif'] = ['SimHei'] # 显示中文
plt.rcParams['axes.unicode_minus'] = False # 显示负号
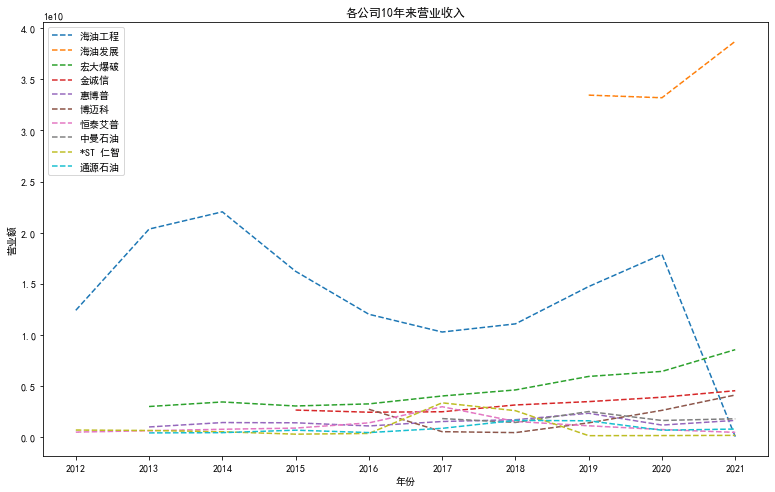
p=plt.figure(figsize=(13,8))
plt.rcParams['lines.linestyle']='--' # 线条显示形式
plt.plot(hygc["年份"],hygc['营业收入(元)'])
plt.plot(hyfz["年份"],hyfz['营业收入(元)'])
plt.plot(hdbp["年份"],hdbp['营业收入(元)'])
plt.plot(jcx["年份"],jcx['营业收入(元)'])
plt.plot(hbp["年份"],hbp['营业收入(元)'])
plt.plot(bmk["年份"],bmk['营业收入(元)'])
plt.plot(htap["年份"],htap['营业收入(元)'])
plt.plot(zmsy["年份"],zmsy['营业收入(元)'])
plt.plot(strz["年份"],strz['营业收入(元)'])
plt.plot(tysy["年份"],tysy['营业收入(元)'])
plt.xlabel('年份')
plt.ylabel('营业额')
plt.xticks(year_list) # 设置x轴坐标 显示1到12月
plt.legend(['海油工程','海油发展','宏大爆破','金诚信','惠博普','博迈科','恒泰艾普','中曼石油','*ST 仁智','通源石油']) # 显示图例
plt.title('各公司10年来营业收入')
plt.show()
p=plt.figure(figsize=(13,8))
plt.rcParams['lines.linestyle']='--' # 线条显示形式
plt.plot(hygc["年份"],hygc['基本每股收益(元/股)'])
plt.plot(hyfz["年份"],hyfz['基本每股收益(元/股)'])
plt.plot(hdbp["年份"],hdbp['基本每股收益(元/股)'])
plt.plot(jcx["年份"],jcx['基本每股收益(元/股)'])
plt.plot(hbp["年份"],hbp['基本每股收益(元/股)'])
plt.plot(bmk["年份"],bmk['基本每股收益(元/股)'])
plt.plot(htap["年份"],htap['基本每股收益(元/股)'])
plt.plot(zmsy["年份"],zmsy['基本每股收益(元/股)'])
plt.plot(strz["年份"],strz['基本每股收益(元/股)'])
plt.plot(tysy["年份"],tysy['基本每股收益(元/股)'])
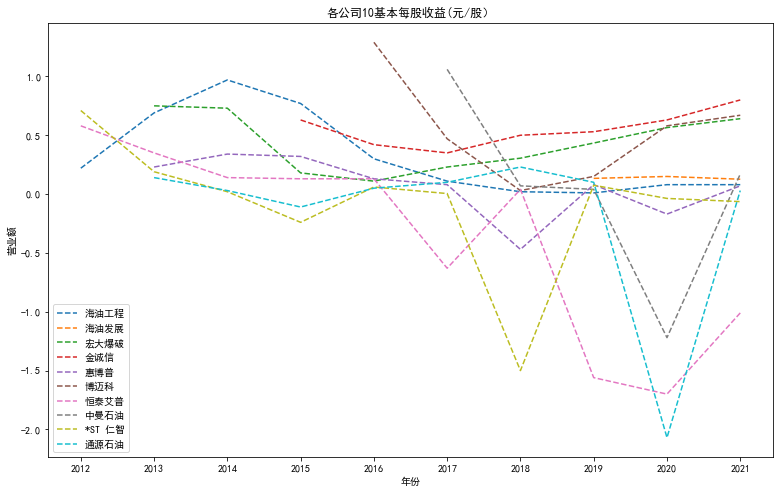
plt.xlabel('年份')
plt.ylabel('营业额')
plt.xticks(year_list) # 设置x轴坐标 显示1到12月
plt.legend(['海油工程','海油发展','宏大爆破','金诚信','惠博普','博迈科','恒泰艾普','中曼石油','*ST 仁智','通源石油']) # 显示图例
plt.title('各公司10基本每股收益(元/股)')
plt.show()
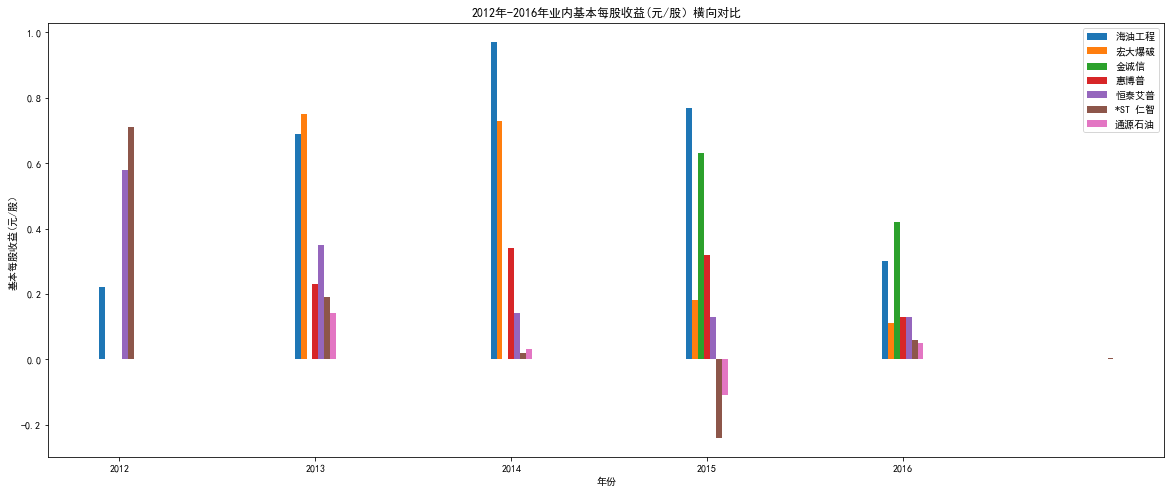
"""2012-2015"""
plt.figure(figsize=(20,8))
plt.bar(hygc["年份"][0:5]-0.09,hygc['基本每股收益(元/股)'][0:5],width=0.03) #画柱状图
plt.bar(hdbp["年份"][0:4]-0.06,hdbp['基本每股收益(元/股)'][0:4],width=0.03) #画柱状图
plt.bar(jcx["年份"][0:2]-0.03,jcx['基本每股收益(元/股)'][0:2],width=0.03)
plt.bar(hbp["年份"][0:4],hbp['基本每股收益(元/股)'][0:4],width=0.03)
plt.bar(htap["年份"][0:5]+0.03,htap['基本每股收益(元/股)'][0:5],width=0.03)
plt.bar(strz["年份"][0:6]+0.06,strz['基本每股收益(元/股)'][0:6],width=0.03)
plt.bar(tysy["年份"][0:4]+0.09,tysy['基本每股收益(元/股)'][0:4],width=0.03)
plt.xlabel('年份')
plt.ylabel('基本每股收益(元/股)')
plt.title('2012年-2016年业内基本每股收益(元/股)横向对比')
plt.legend(['海油工程','宏大爆破','金诚信','惠博普','恒泰艾普','*ST 仁智','通源石油'])
plt.xticks(year_list[0:5])
plt.show() # 显示图片
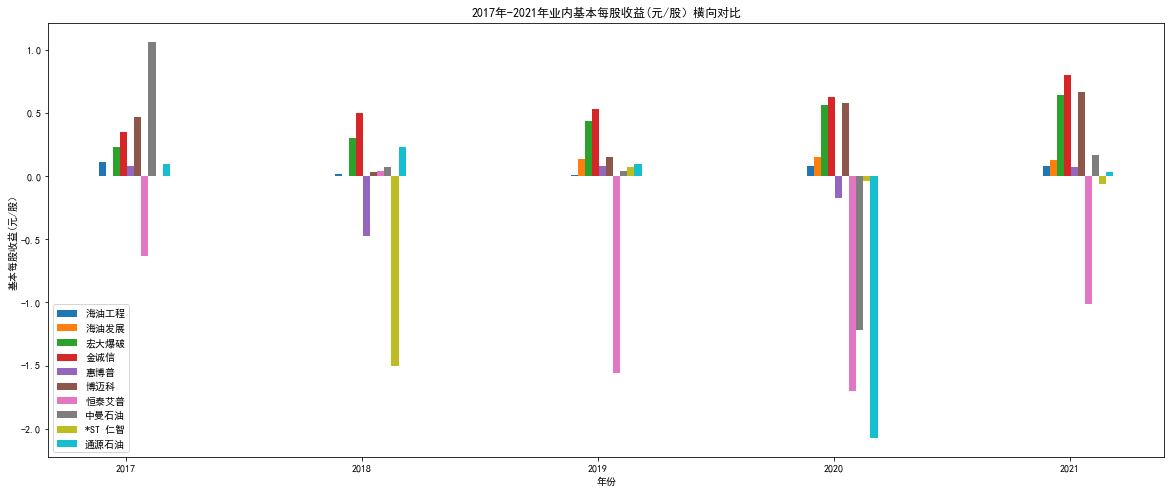
"""2017-2021"""
plt.figure(figsize=(20,8))
plt.bar(hygc["年份"][5:]-0.1,hygc['基本每股收益(元/股)'][5:],width=0.03)
plt.bar(hyfz["年份"]-0.07,hyfz['基本每股收益(元/股)'],width=0.03)
plt.bar(hdbp["年份"][4:]-0.04,hdbp['基本每股收益(元/股)'][4:],width=0.03)
plt.bar(jcx["年份"][2:]-0.01,jcx['基本每股收益(元/股)'][2:],width=0.03)
plt.bar(hbp["年份"][4:]+0.02,hbp['基本每股收益(元/股)'][4:],width=0.03)
plt.bar(bmk["年份"][1:]+0.05,bmk['基本每股收益(元/股)'][1:],width=0.03)
plt.bar(htap["年份"][5:]+0.08,htap['基本每股收益(元/股)'][5:],width=0.03)
plt.bar(zmsy["年份"]+0.11,zmsy['基本每股收益(元/股)'],width=0.03)
plt.bar(strz["年份"][6:]+0.14,strz['基本每股收益(元/股)'][6:],width=0.03)
plt.bar(tysy["年份"][4:]+0.17,tysy['基本每股收益(元/股)'][4:],width=0.03)
plt.xlabel('年份')
plt.ylabel('基本每股收益(元/股)')
plt.title('2017年-2021年业内基本每股收益(元/股)横向对比')
plt.legend(['海油工程','海油发展','宏大爆破','金诚信','惠博普','博迈科','恒泰艾普','中曼石油','*ST 仁智','通源石油']) # 显示图例
plt.xticks(year_list[5:])
plt.show() # 显示图片
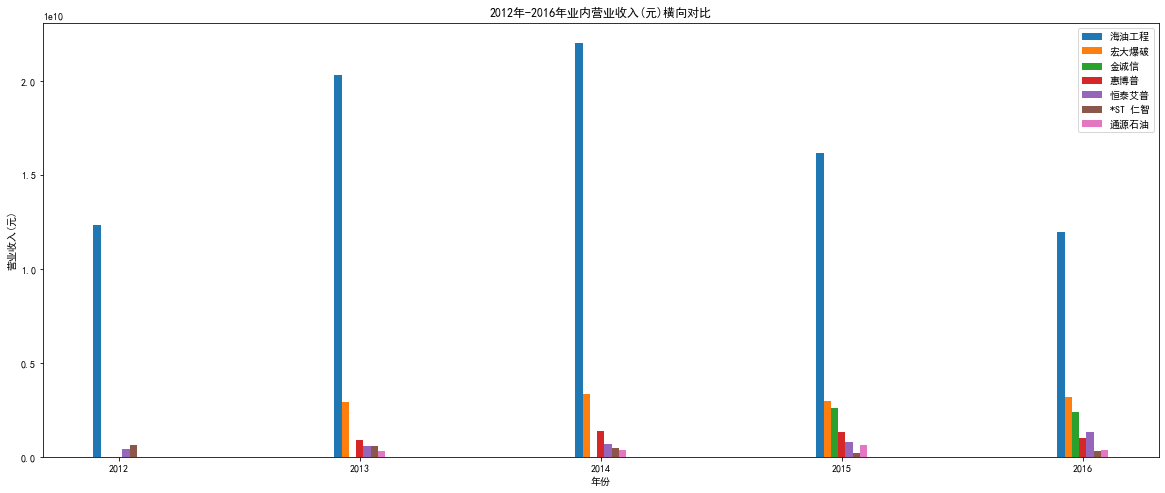
"""2012-2015"""
plt.figure(figsize=(20,8))
plt.bar(hygc["年份"][0:5]-0.09,hygc['营业收入(元)'][0:5],width=0.03) #画柱状图
plt.bar(hdbp["年份"][0:4]-0.06,hdbp['营业收入(元)'][0:4],width=0.03) #画柱状图
plt.bar(jcx["年份"][0:2]-0.03,jcx['营业收入(元)'][0:2],width=0.03)
plt.bar(hbp["年份"][0:4],hbp['营业收入(元)'][0:4],width=0.03)
plt.bar(htap["年份"][0:5]+0.03,htap['营业收入(元)'][0:5],width=0.03)
plt.bar(strz["年份"][0:5]+0.06,strz['营业收入(元)'][0:5],width=0.03)
plt.bar(tysy["年份"][0:4]+0.09,tysy['营业收入(元)'][0:4],width=0.03)
plt.xlabel('年份')
plt.ylabel('营业收入(元)')
plt.title('2012年-2016年业内营业收入(元)横向对比')
plt.legend(['海油工程','宏大爆破','金诚信','惠博普','恒泰艾普','*ST 仁智','通源石油'])
plt.xticks(year_list[0:5])
plt.show() # 显示图片
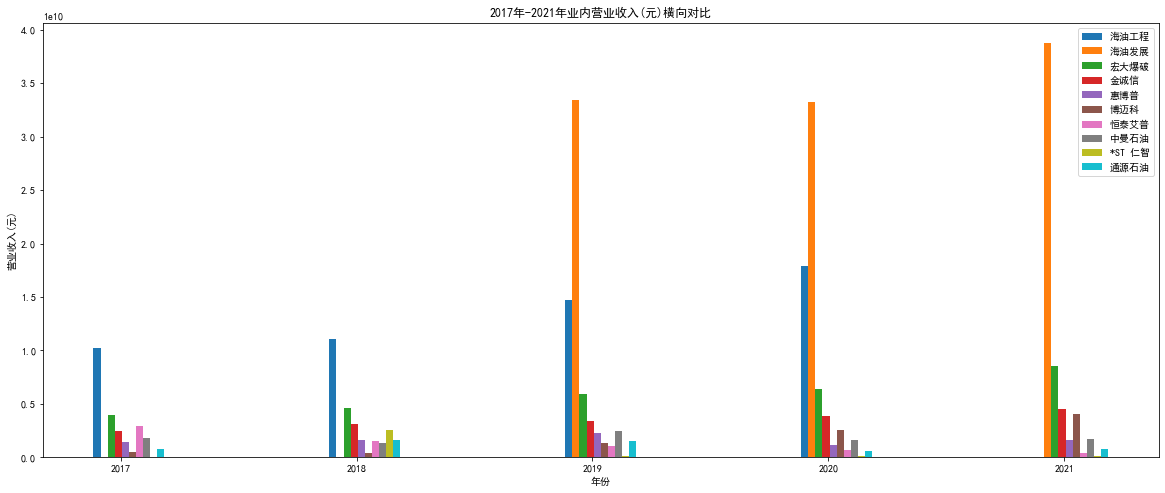
"""2017-2021"""
plt.figure(figsize=(20,8))
plt.bar(hygc["年份"][5:]-0.1,hygc["营业收入(元)"][5:],width=0.03)
plt.bar(hyfz["年份"]-0.07,hyfz['营业收入(元)'],width=0.03)
plt.bar(hdbp["年份"][4:]-0.04,hdbp['营业收入(元)'][4:],width=0.03)
plt.bar(jcx["年份"][2:]-0.01,jcx['营业收入(元)'][2:],width=0.03)
plt.bar(hbp["年份"][4:]+0.02,hbp['营业收入(元)'][4:],width=0.03)
plt.bar(bmk["年份"][1:]+0.05,bmk['营业收入(元)'][1:],width=0.03)
plt.bar(htap["年份"][5:]+0.08,htap['营业收入(元)'][5:],width=0.03)
plt.bar(zmsy["年份"]+0.11,zmsy['营业收入(元)'],width=0.03)
plt.bar(strz["年份"][6:]+0.14,strz['营业收入(元)'][6:],width=0.03)
plt.bar(tysy["年份"][4:]+0.17,tysy['营业收入(元)'][4:],width=0.03)
plt.xlabel('年份')
plt.ylabel('营业收入(元))')
plt.title('2017年-2021年业内营业收入(元)横向对比')
plt.legend(['海油工程','海油发展','宏大爆破','金诚信','惠博普','博迈科','恒泰艾普','中曼石油','*ST 仁智','通源石油']) # 显示图例
plt.xticks(year_list[5:])
plt.show() # 显示图片